In this article, you will learn different types of flowcharts and how they are used for different purposes. You will also learn how to create great flowcharts with Sketchboard’s online flowchart maker in 4 steps.
What is a flowchart?
A flowchart is a visual description of the components -which are often sequential- of a process or workflow. Flowcharts are one of the most commonly used types of diagrams in diverse domains from software design to manufacturing and business development. Flowcharts can be created for different purposes in different forms. However, the fundamental idea of visualizing the steps of a process to communicate it more effectively is the same for all flowcharts.
Flowcharts can be as simple as a quick sketch on a piece of paper. They can also be quite complex, created by sophisticated software that depicts a comprehensive process with countless elements. A flowchart can be also named as flow chart, process flowchart, or process flow diagram.
Step 0: Why do you need a flowchart?
Flowcharts are very useful tools when there is a need to explain a certain activity and its sequential steps effectively. Although the main purpose stays the same, it is important to keep in mind that different use cases might require different types of flowcharts. Here is a quick list of different use cases of a flowchart.
Understanding the nature of a process
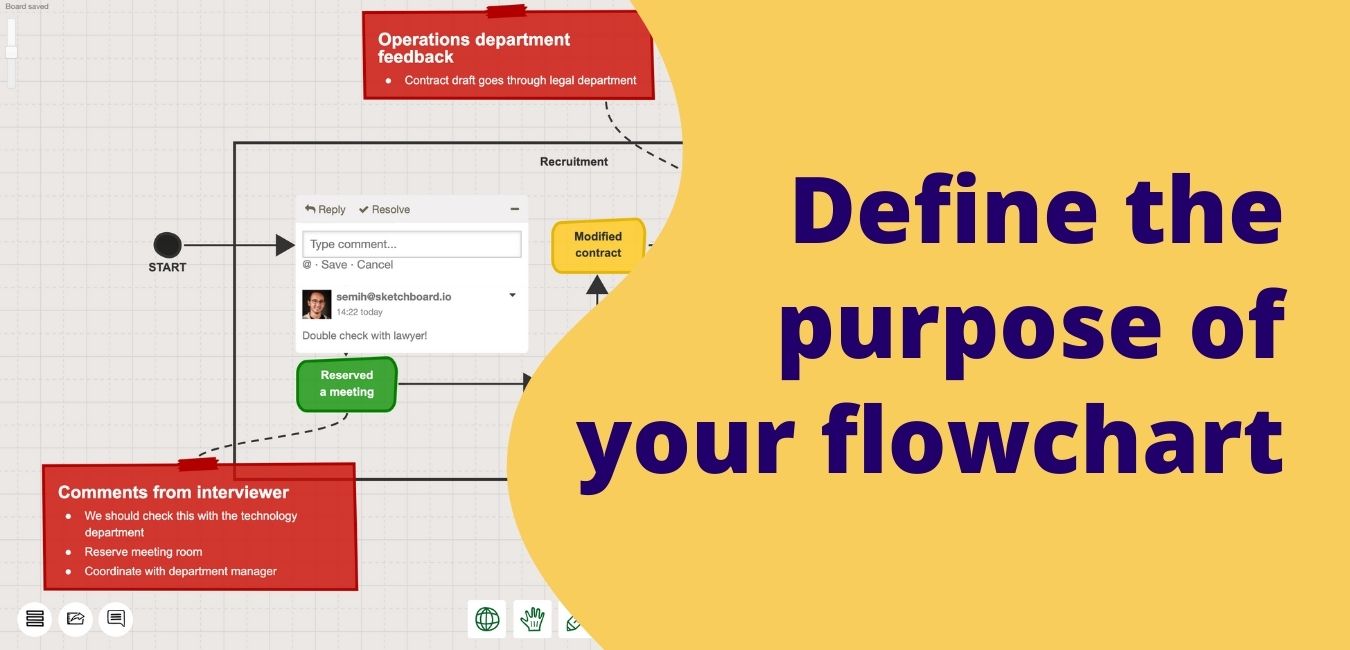
In today’s currently changing environment, it is not always straightforward to grasp a basic understanding of how things work. It can be a software design of an HR tool, hardware manufacturing process, or a decision-making process. Visualizing a process helps everyone to be on the same page. Flowcharts bring significant value when there is a need to develop a common understanding of how a particular process is done.
Creating a common perception between stakeholders
Some processes have too many steps that nobody can easily comprehend the big picture. Flowcharts step in these cases to develop a common understanding for everyone involved. They can either prepare everyone for an “aha!” moment or just work as a starting point for a deeper discussion. Making the flowchart high-level or more detailed can facilitate different conversations between stakeholders.
Improving or automating a process
To make something better, it is important to comprehend the current situation first. Flowcharts make it easier to identify bottlenecks during the improvement phase of a process. The “as is” version and improved version of the process can be visualized via flowcharts. In addition to that, different improvement ideas can be discussed and prototyped on the flowchart before implementation. They can save time during the planning and integration phases of the improvements.
Reporting and documenting
Many organizations are having internal or external audits for different purposes. Flowcharts are very common tools to document steps of a process for reporting. Flowcharts can efficiently explain an activity, a workflow, or a decision-making process to an outsider. Documentation of such critical processes can make reporting and controlling tasks easier and smoother.
Types of flowcharts
Flowcharts are categorized in various ways. As the flowchart concept finds broad use in different fields every day, the types are getting more diverse too. For example, Chaudhuri in his book Flowchart and Algorithm Basics classifies flowcharts into two categories:
- program flowchart is widely used to visualize the steps of how a computer program solves a problem
- system flowchart aims to depict how multiple solutions interact with each other in a broader system
With that said, there are more categories worth to mention such as the document flowchart that visualizes how a document is processed within a certain system, the data flowchart that depicts the data flow in the process.
Another categorization is based on how detailed the flowchart is:
- a macro flowchart or general flowchart provides a high-level picture
- a detailed flowchart includes an in-depth perspective
The swimlane diagram or swimlane flowchart is another type of flowchart that includes an additional layer where cross-functionality can be depicted through the “swimlanes”. Although named differently, there are more diagram types that are similar to flowcharts: such as Unified Modeling Language (UML).
It is also important to note that a flowchart is one of the process mapping tools that can be used for various purposes. However, other process mapping tools such as the suppliers-inputs-process-outputs-customers (SIPOC or COPIS) tool and value-stream maps can be more beneficial in some particular situations.
4-step guideline to create flowcharts
Regardless of the purpose of your flowchart, here is a 4-step guideline to create one.
Step 1: Clarify the purpose of the flowchart
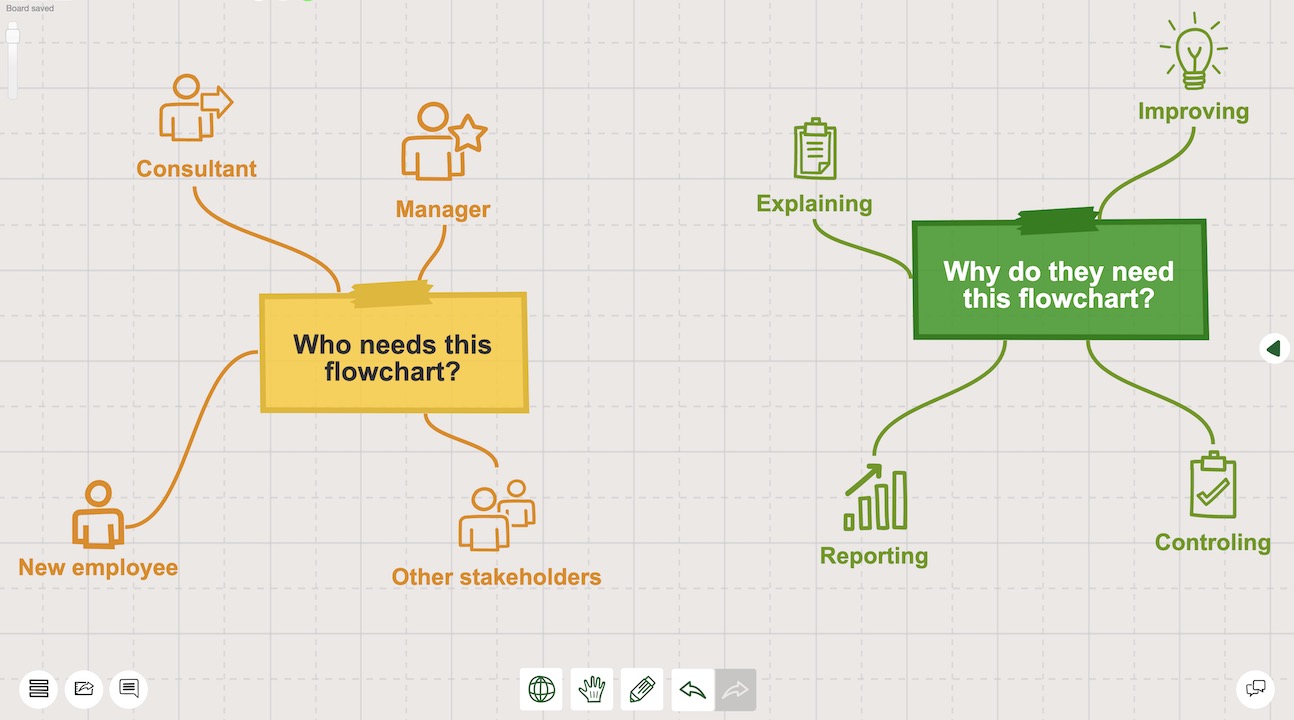
It is also a good idea to clarify the target audience and purpose of your flowchart. For example: Do you need a flowchart to explain your process to new employees, or do you need it to improve the current workflow? Check out the “Why do you need a flowchart?” section above if you haven’t yet. Answer to this question can save a lot of time, and make your flowcharting experience smoother. Without defining the purpose and the target audience, it is not possible to decide how much detail you would like to include in your flowchart.
Step 2: Map out the process items of the flowchart
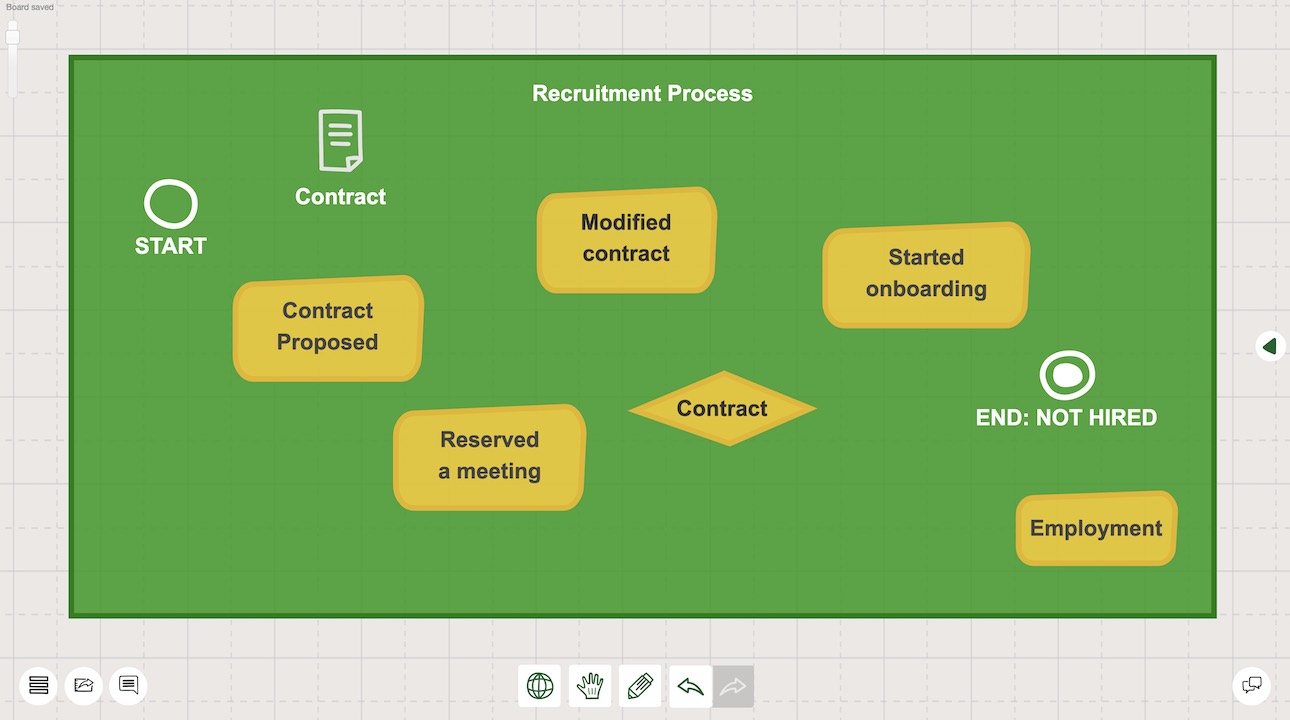
Depending on the type of flowchart you would like to use, there are different flowchart symbols. Some diagram types such as Unified Modelling Language (UML) or Business Process Model and Notation (BPMN) diagrams have a more structured icon list with defined rules. On the other hand, you can build your own visual language with more creative icons if you like. Just keep in mind that
Step 3: Create connections between flowchart items
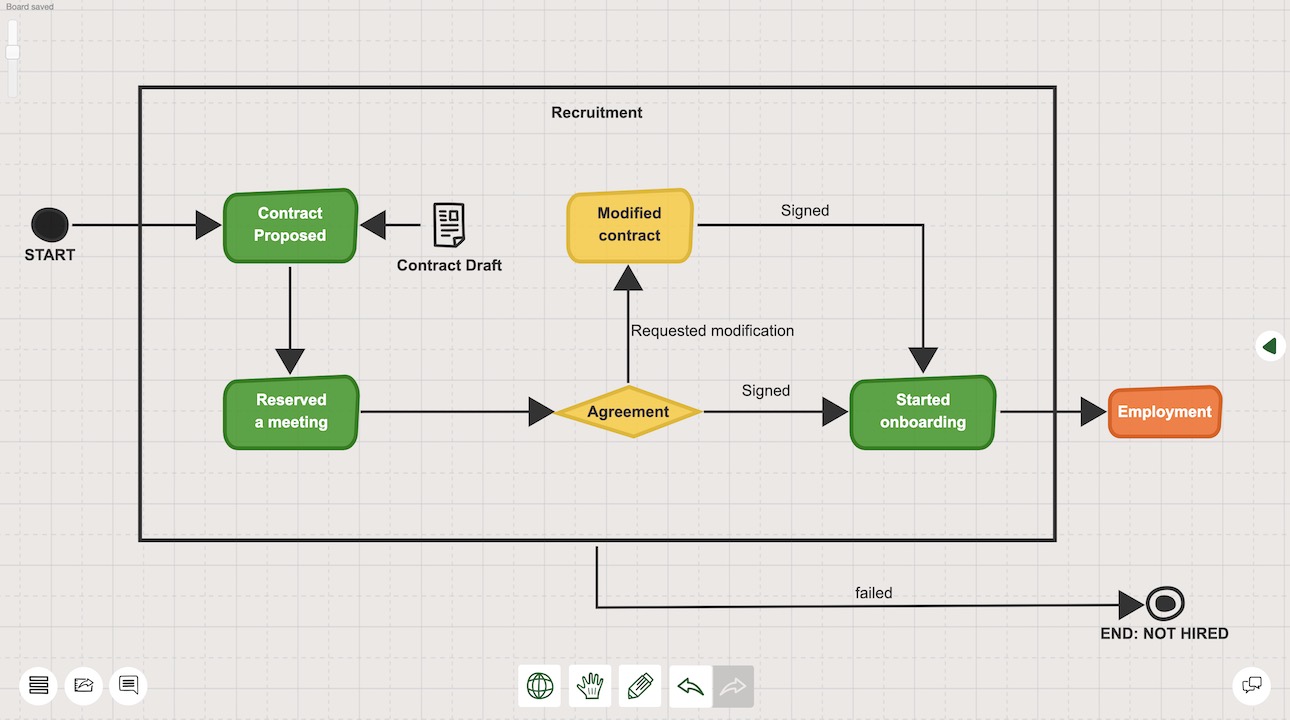
Connections are the fundamental components of every flowchart. If your purpose is to understand the nature of a sophisticated process, this phase is the core of your flowcharting experience. Once you understand how various components work together in the system, you are successful in your pursuit. Just make sure you put enough time and effort into this. So that you create a comprehensive first draft. Once your first version is ready, it is time to move forward to the last step.
Step 4: Review, share, receive feedback, and improve
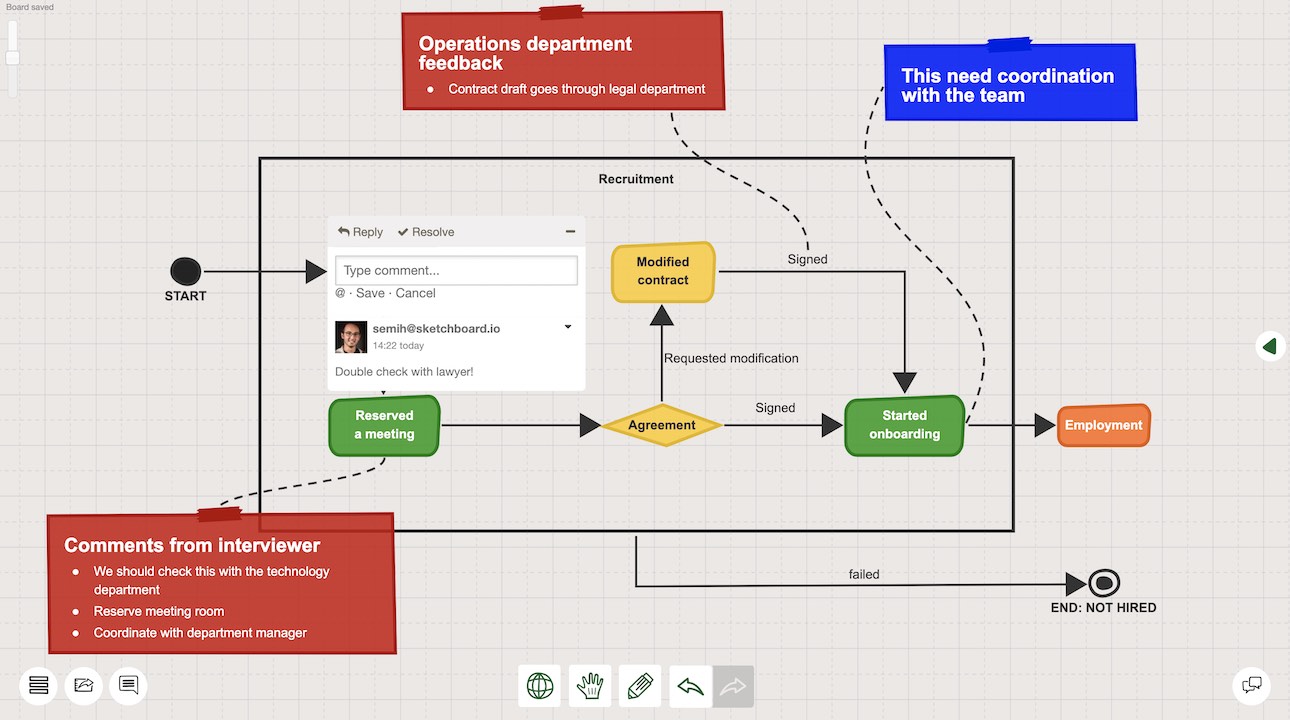
If your purpose is to improve the process you visualized, this is the core point of your flowchart creation process. This is the time where you can ideate multiple versions to initiate discussions. You can benchmark your versions with your current processes and your competitors’ processes. Then sharing it with a broader level of stakeholders to widen your perspective can make a difference. Don’t be afraid of having a couple of iterative rounds for further improvements.
Flowchart examples
There are countless use cases of flowcharts in almost every field such as software development, healthcare, education, engineering, and business development. In this section, you will find some useful examples that you can use as templates for inspiration.
Decision Flowchart

Decision flowcharts provide a comprehensive visual guide for the decision-makers to act on particular situations. When dealing with complex problems, making a decision flowchart can help to ensure that rational decisions are agreed upon and implemented on an organizational level.
Data Flow Diagram (DFD)
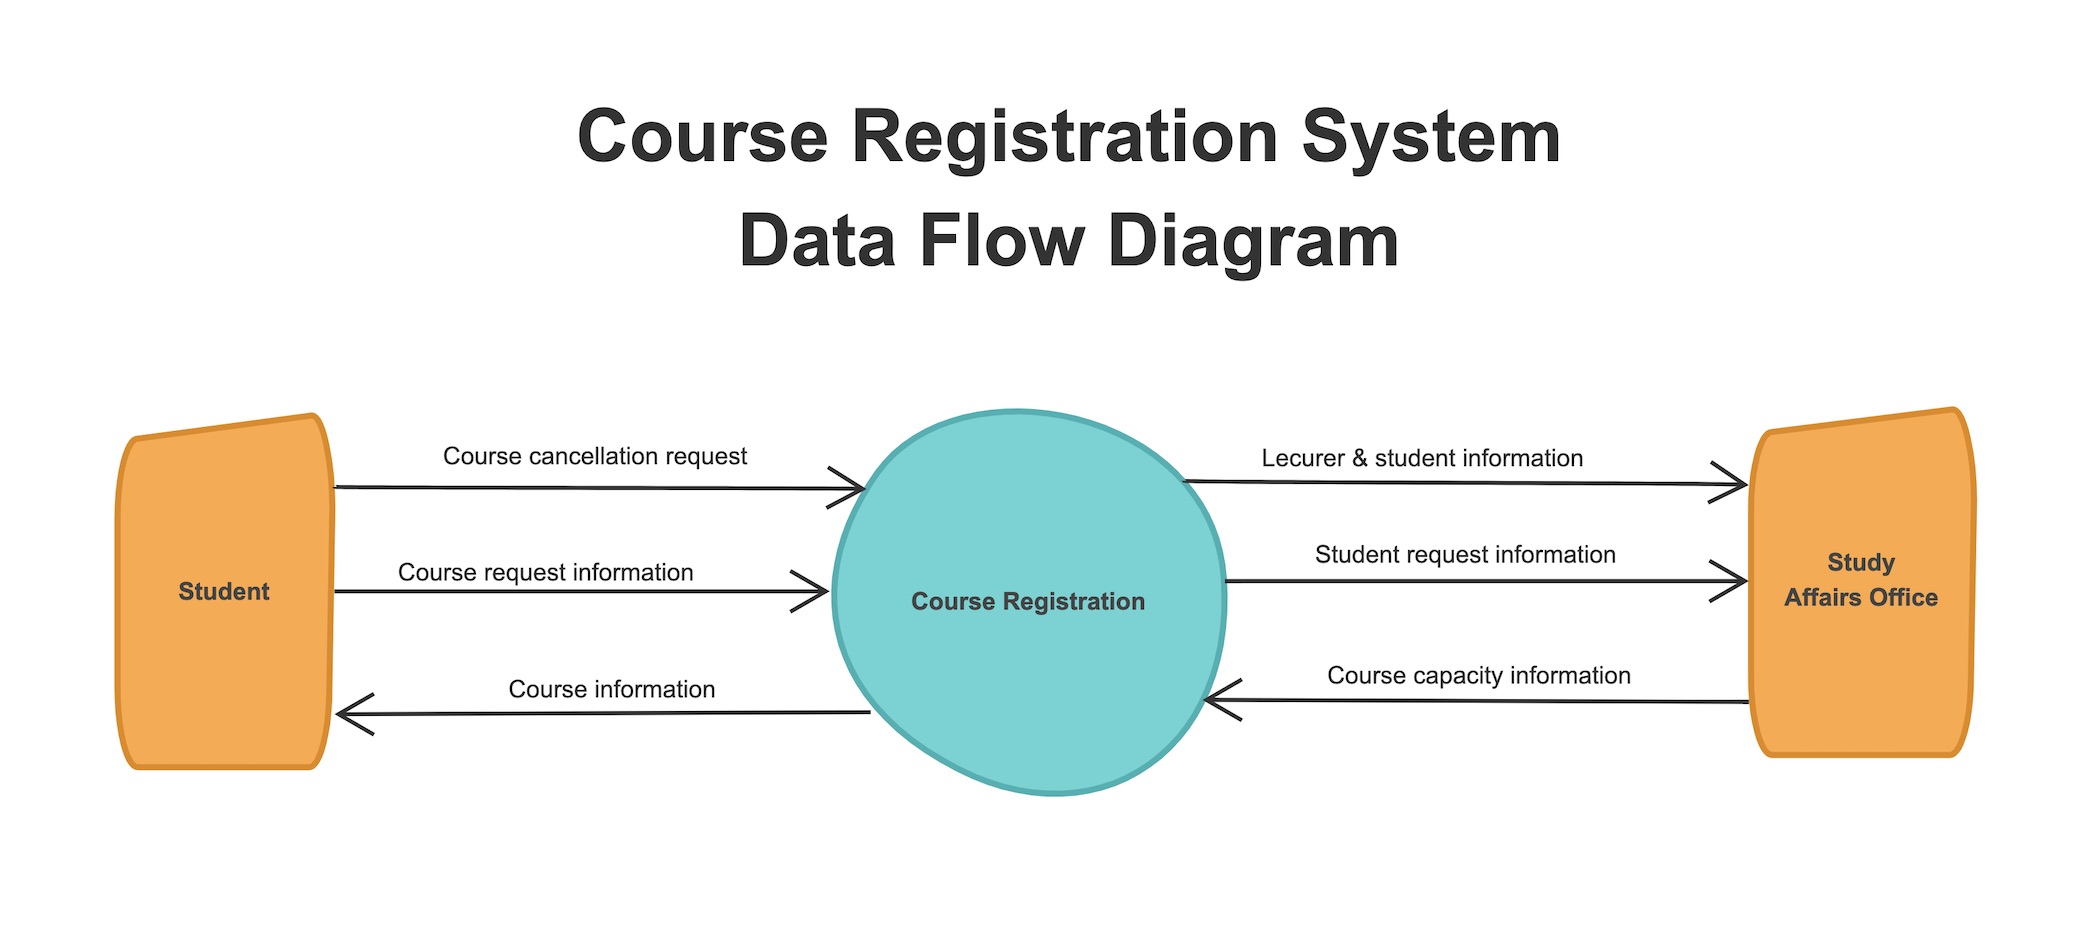
As an alternative, Unified Modeling Language (UML) Activity diagrams can be used to represent data flow in a system and provide similar functionality. There are different notations to be used for data-flow diagrams. Use a flexible flowchart tool to ideate your data flow diagrams quickly with your team.
Workflow Flowchart
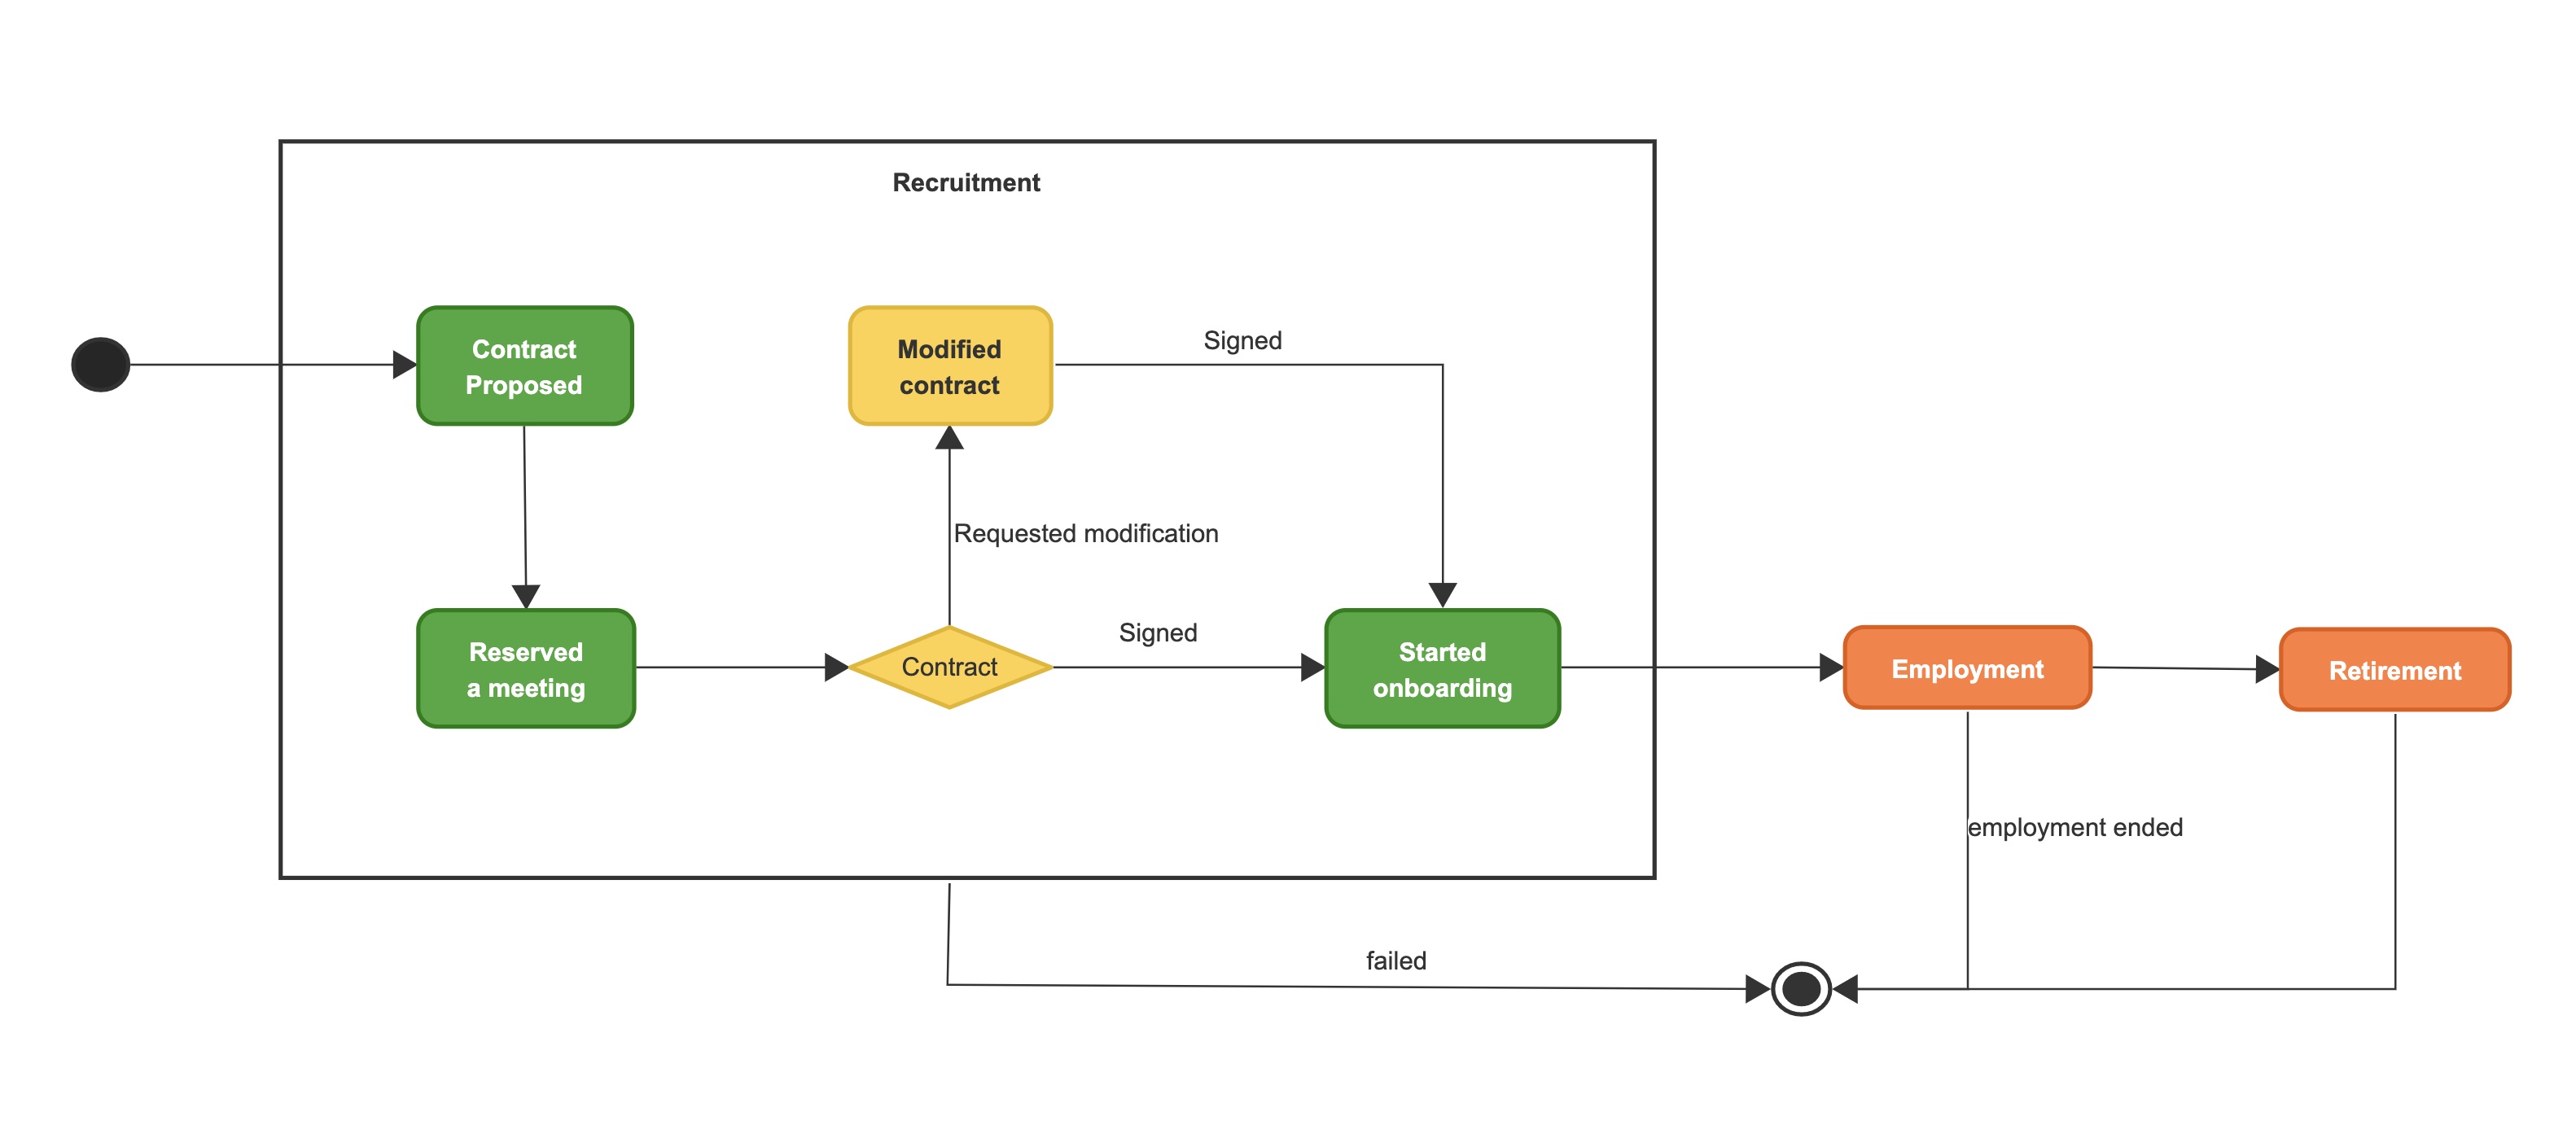
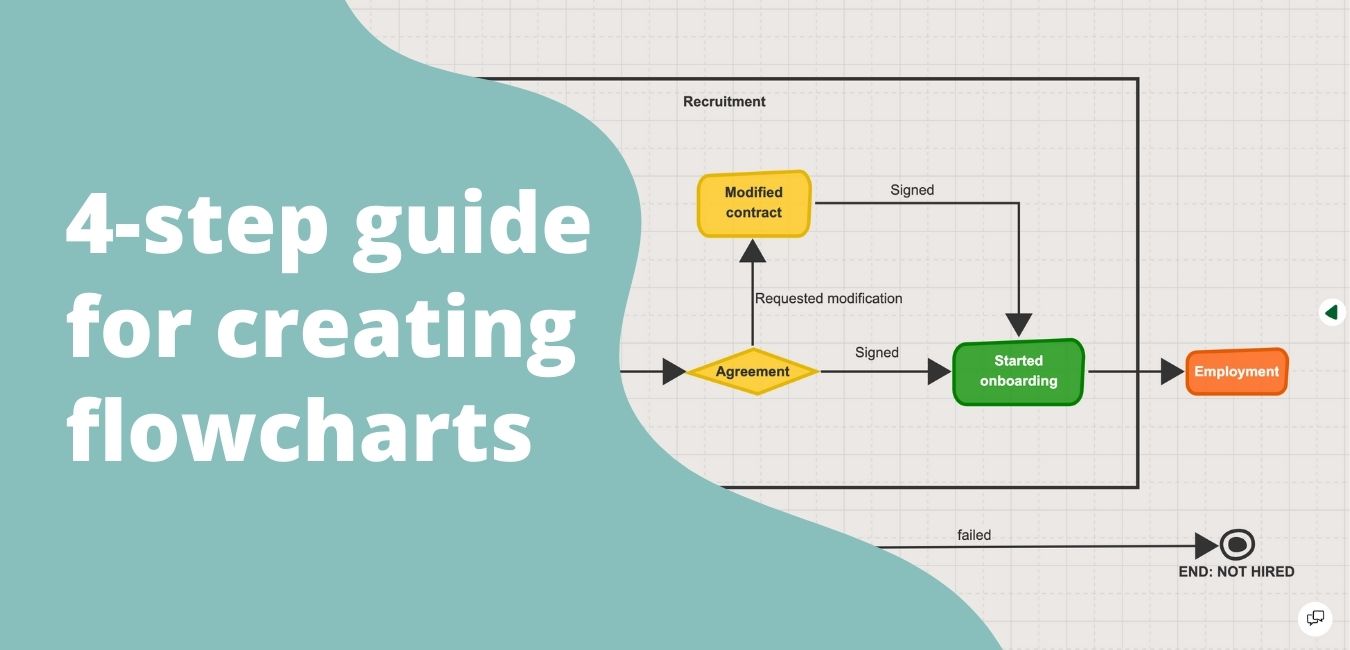
As an example, you can see a workflow diagram of a recruitment process above. Although there are different versions of the workflow diagrams depending on the purpose, they basically include activity shapes and arrows to represent the flow.
Swimlane Flowchart
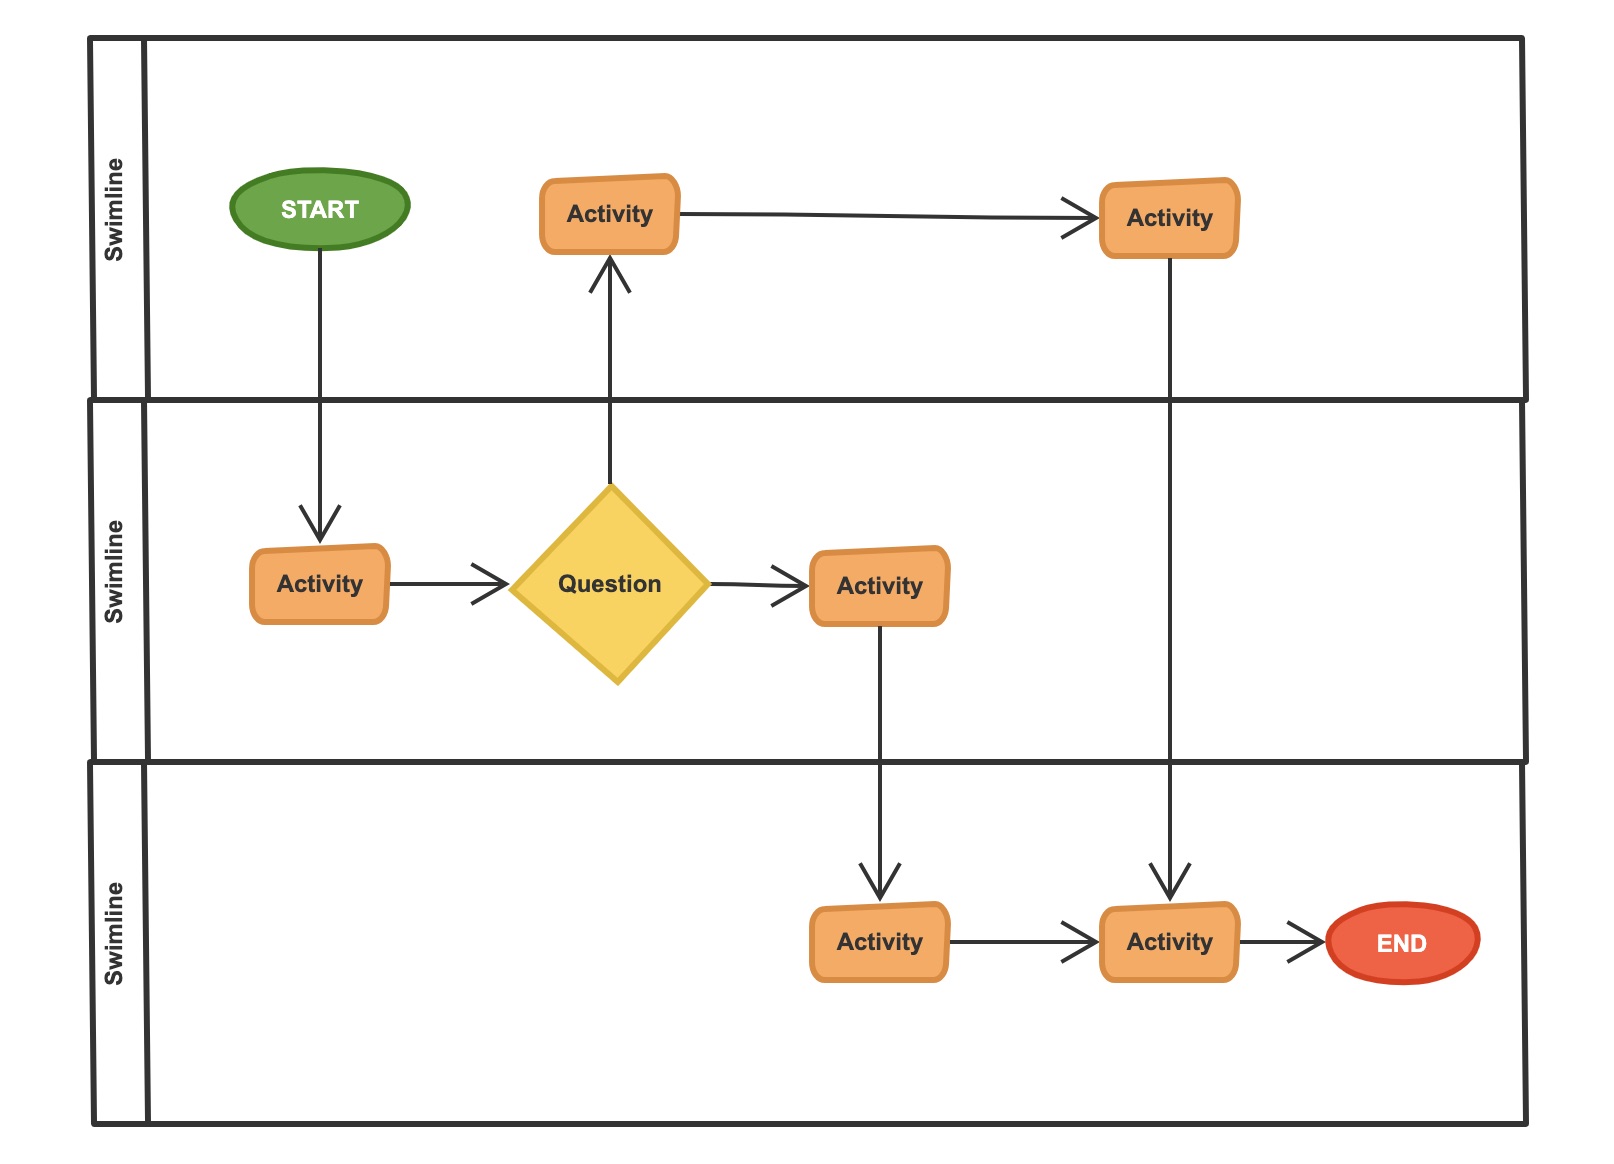
Swimlanes often represent a department, a unit, or a single job position. Other flowchart components are added to different swimlanes to distinguish the responsibilities of each activity item.
